
Adding a Volatility Gate to My New Dual Allocator Strategy
Part 28 talks about upgrading the V2 of my Dual Allocator strategy with a volatility gate

This is part 28 of my series — Building & Scaling Algorithmic Trading Strategies
Recap: Where We Left Off
In the previous post, I redesigned the dual-allocator momentum system that used trend analysis across multiple moving averages to determine positions in TQQQ, QQQ, SQQQ, or cash. The system achieved a 302% total return over 10 years with a CAGR of 14.93% and Sharpe ratio of 1.035. This was V2.
However, the recent iteration had a limitation: it treated all market conditions the same. Whether the VIX was at 12 or 35, the system would take leveraged positions based purely on trend signals.
This post documents the development of the next iteration, which adds a volatility filtering mechanism to address this gap. I present to you V3.
Analyzing VIX and Leveraged ETF Performance
To understand when leveraged positions make sense, I analyzed 10 years of VIX data alongside leveraged ETF returns.
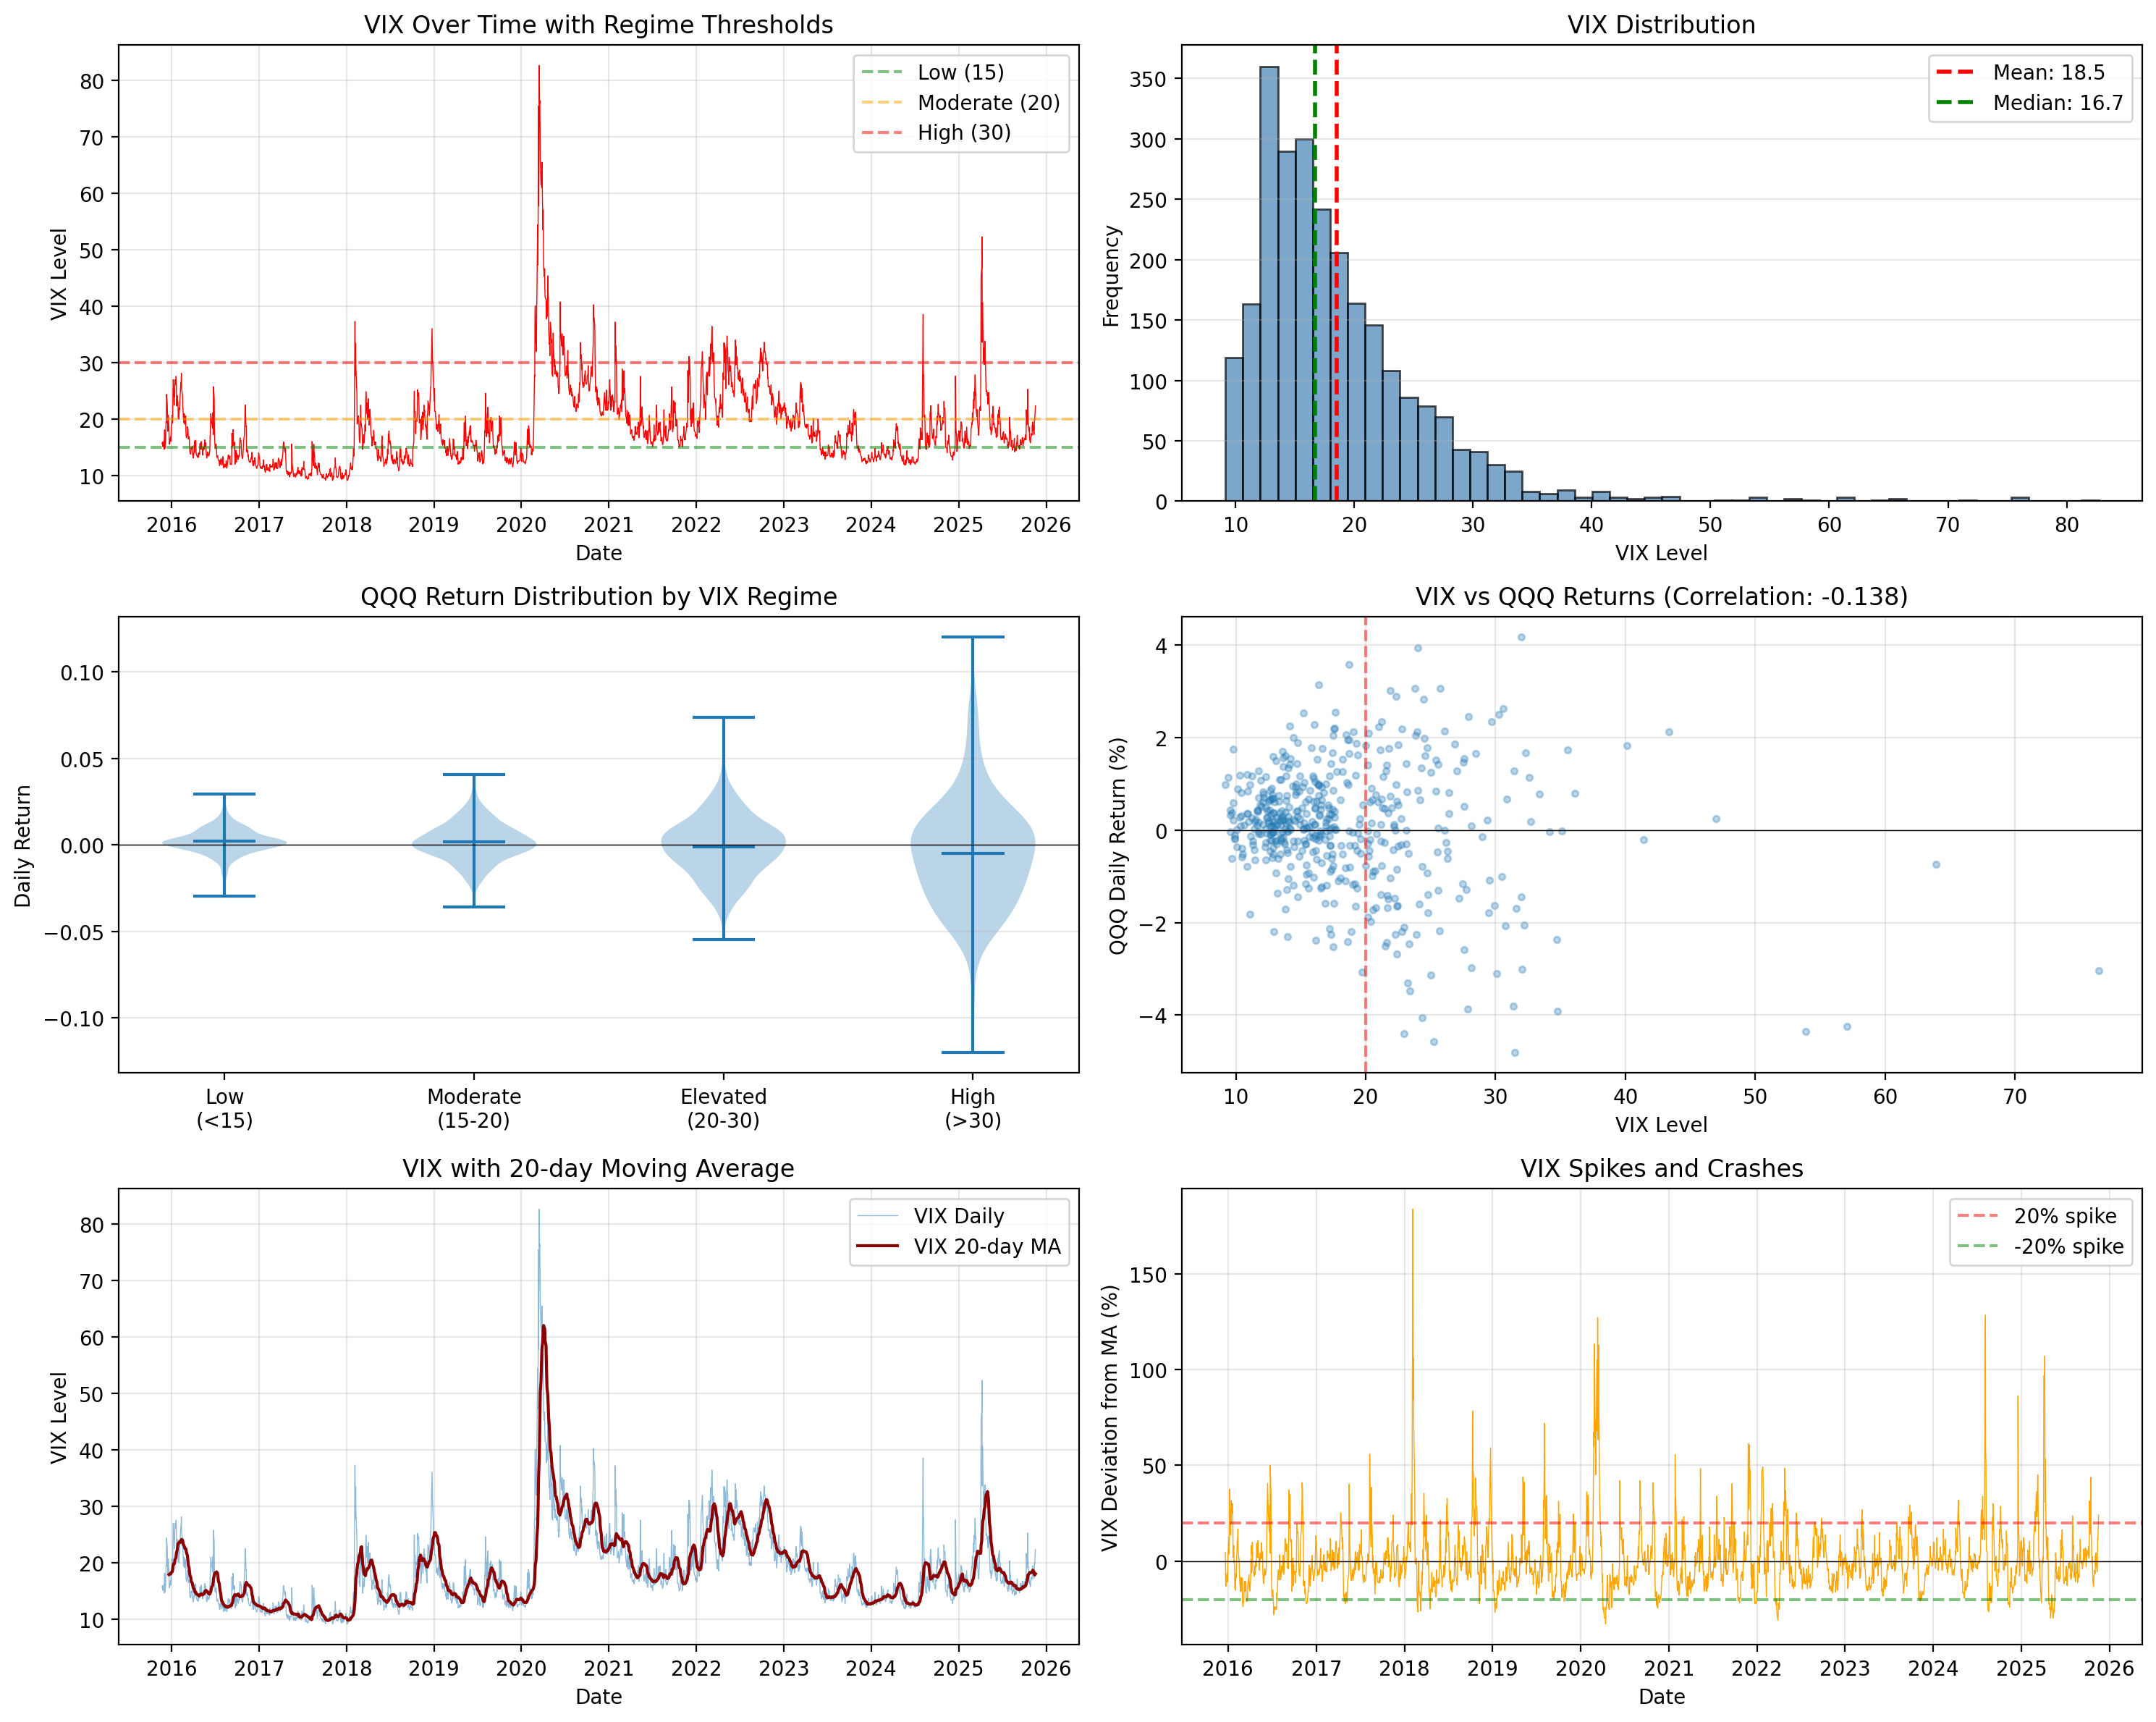
The analysis revealed a clear pattern:
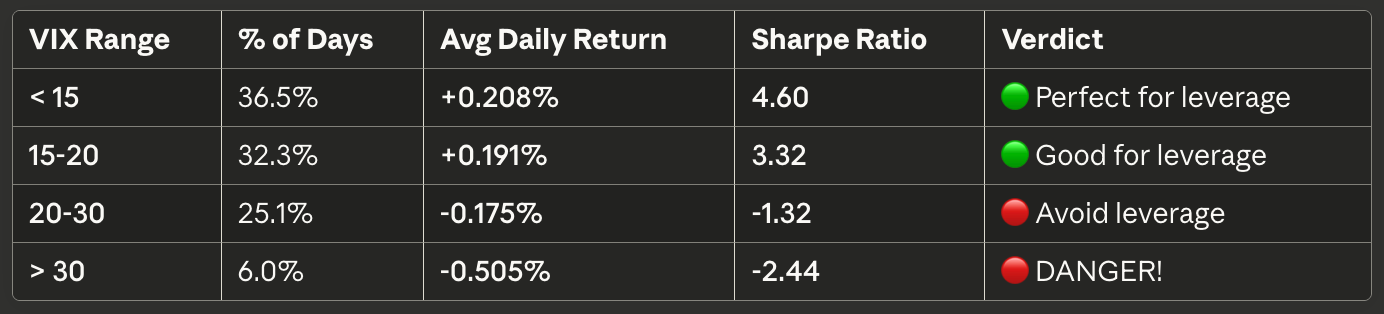
The data shows that leveraged ETF returns turn negative when VIX exceeds 20. This observation became the basis for the volatility filtering component of the next iteration.
Dual Allocator with Volatility Gate Architecture: Two-Factor Scoring System
The new system extends my previous trend analysis by adding a volatility dimension. Both factors contribute to position decisions.
Factor 1: Trend Score (-100 to +100)
The trend score from my previous version remains unchanged, analyzing three components:
MA Alignment (40% weight): Measures agreement across all timeframes
Velocity (30% weight): Measures trend rate of change
Acceleration (30% weight): Measures momentum changes
Factor 2: Volatility Score (0 to 100)
The VIX level maps to a volatility score:
VIX < 15: Score = 100
VIX 15-20: Score = 70-100
VIX 20-30: Score = 30-70
VIX > 30: Score = 0-30
Position Determination
The system combines both scores to determine positions:
Strong Trend (>+60) + Low Volatility (>70)
→ TQQQ at 1.0x leverage (full position)

Moderate Trend (+20 to +60) + Medium Vol (40-70)
→ QQQ at 0.5-1.0x leverage (unleveraged)

Weak Signal or High VIX
→ CASH (preserve capital)

Strong Downtrend (<-60) + Any Volatility
→ SQQQ at 0.7-1.0x leverage (short position)
Variable position sizing (0.5x, 0.7x, 0.8x, 1.0x) reduces turnover compared to binary signals while allowing gradual position adjustments based on conviction levels.
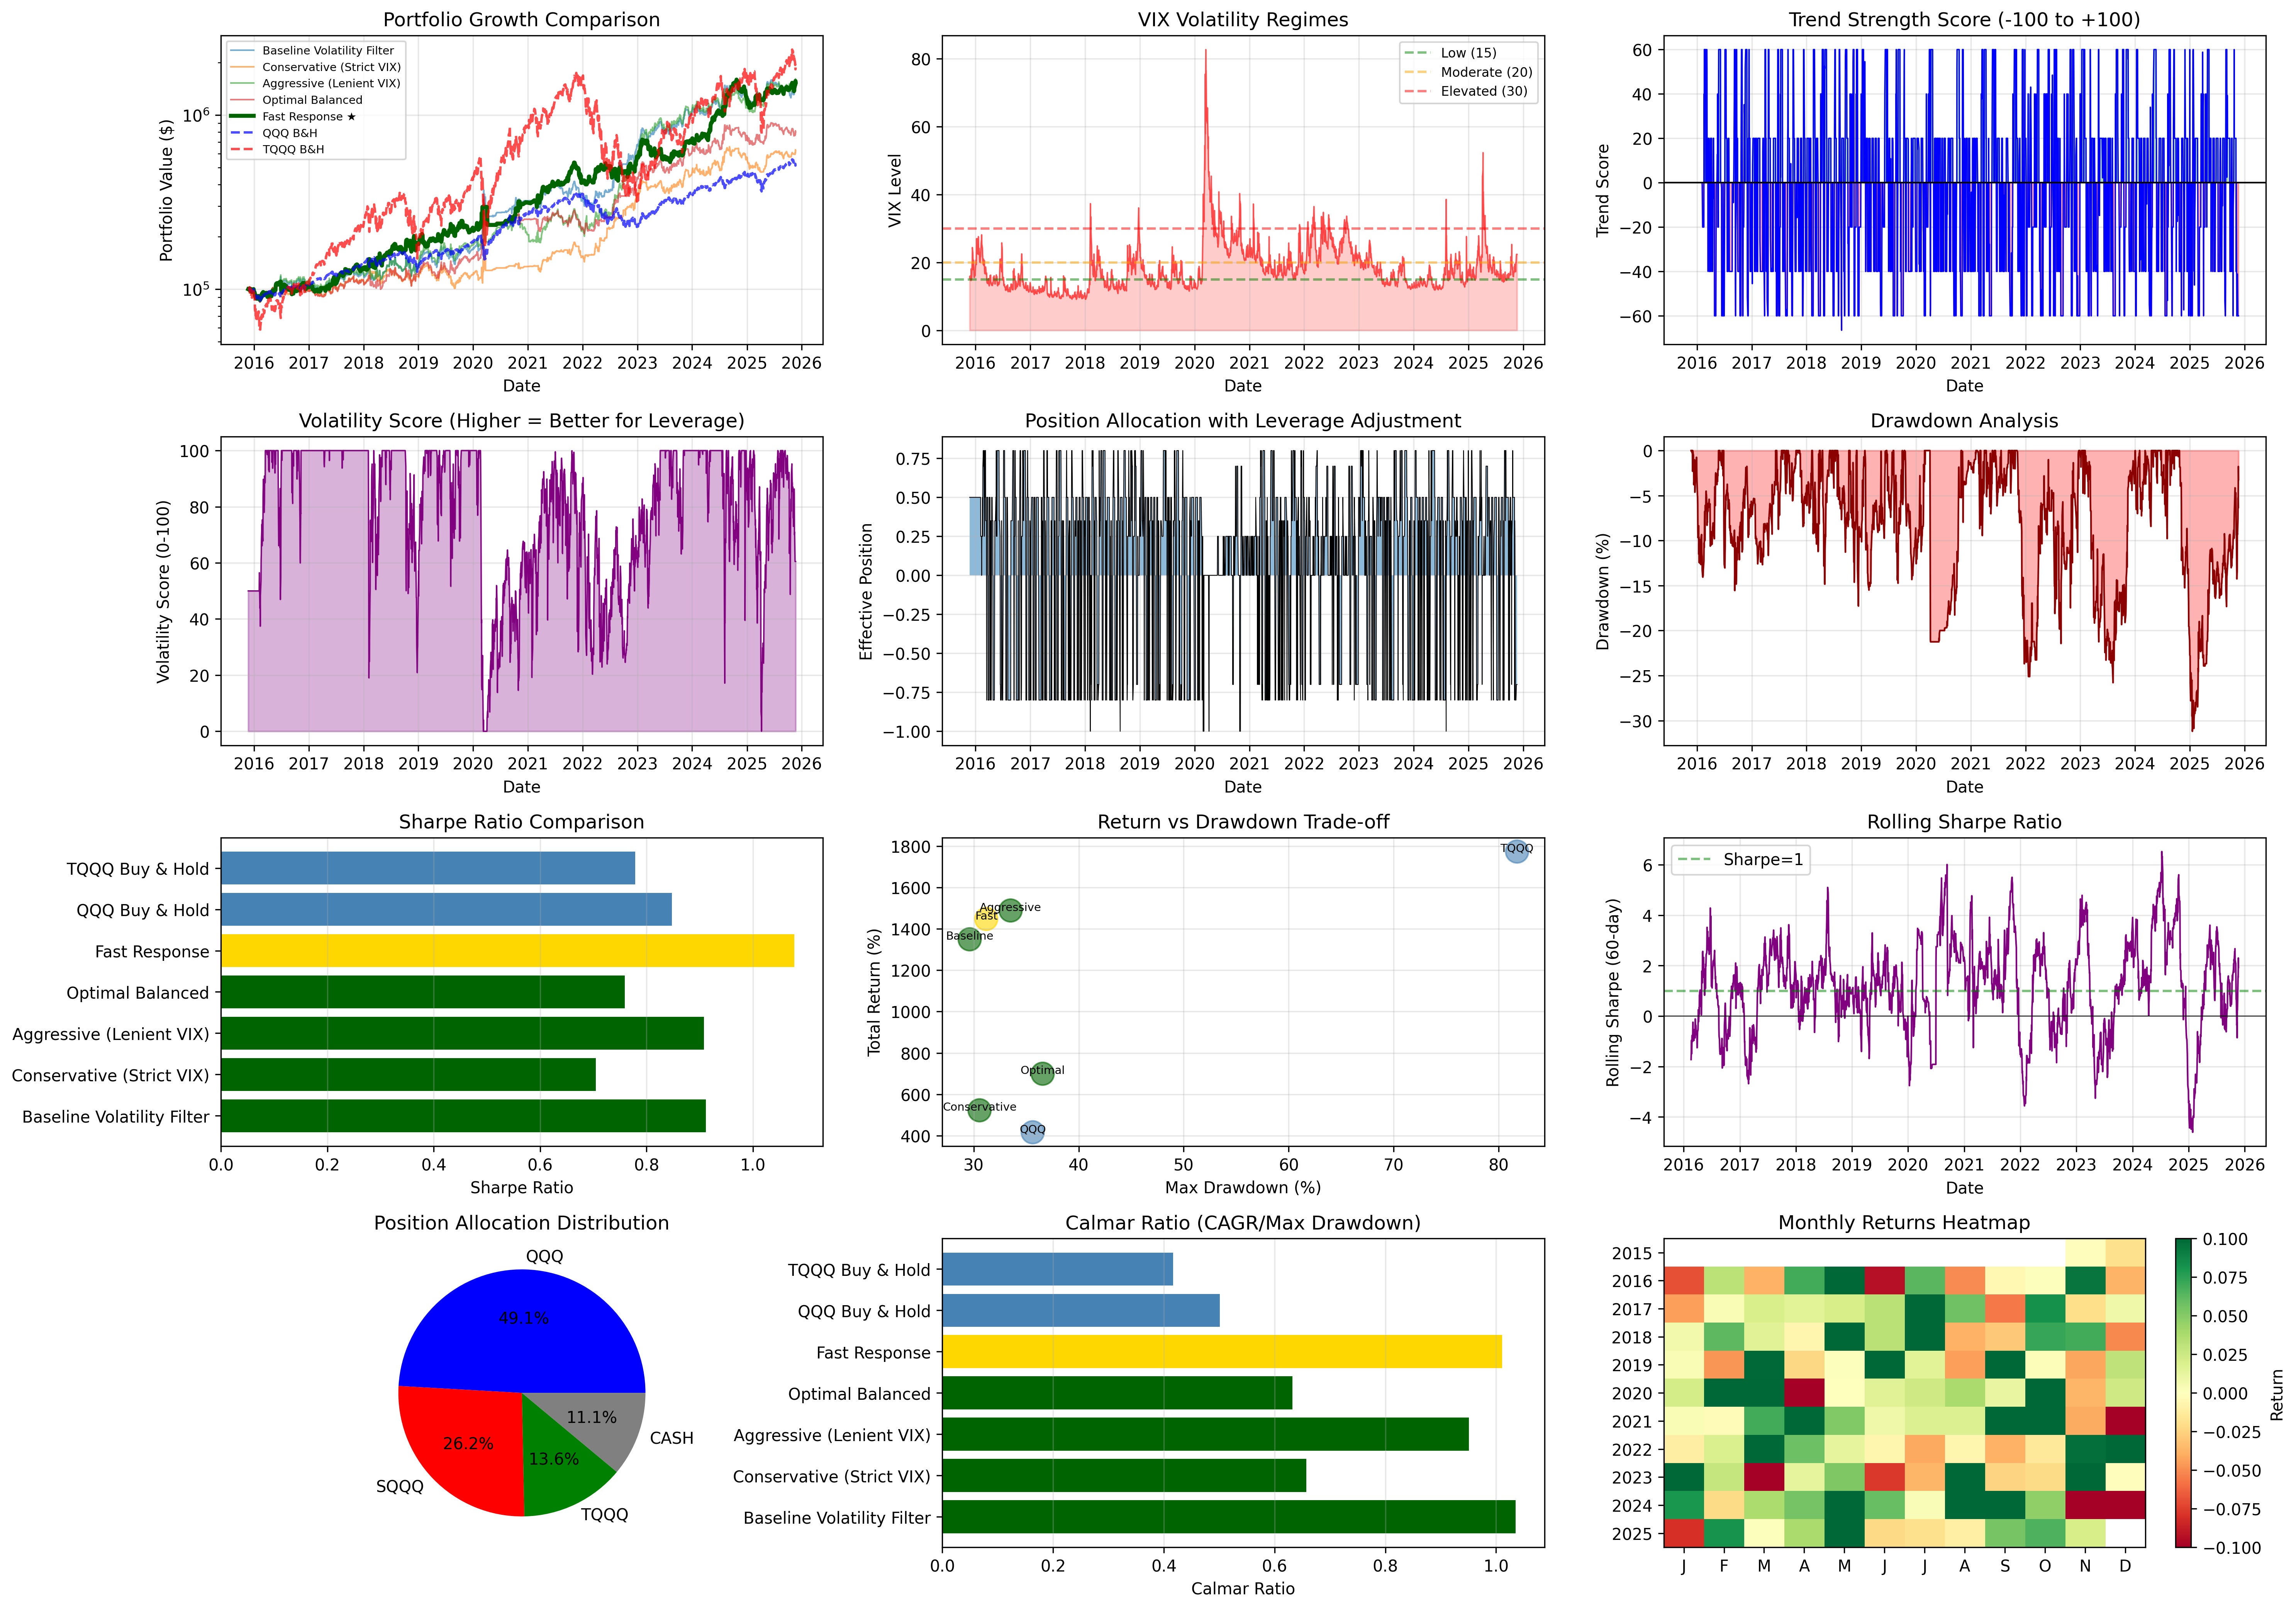
Performance Results (November 2015 - November 2025)
Here are the backtested results for this iteration:
Performance Metrics
Total Return: 1,447.50%
CAGR: 31.53%
Sharpe Ratio: 1.078
Max Drawdown: -31.19%
Win Rate: 48.39%
Sortino Ratio: 1.350 (good downside protection)
Calmar Ratio: 1.011 (good ratio of CAGR vs. Max Drawdown)
Comparison Across Strategies
Improved absolute returns by 379% and CAGR by 16.6%
Achieved the highest Sharpe ratio across all tested strategies
Maximum drawdown was -31% compared to -82% for TQQQ buy-and-hold
Win rate of 48% indicates asymmetric payoffs drive overall returns
Parameter Selection and Optimization
Moving Average Windows: [5, 10, 20, 50]
Testing showed that faster-responding moving averages outperformed slower alternatives for this period:
2015-2025 was a primarily trending period
Earlier trend detection improved entry timing
Faster exits reduced drawdown magnitude
Achieved Sharpe 1.078 vs 0.912 baseline
Threshold Parameters
Selected thresholds after testing multiple alternatives:
Velocity threshold filters low-conviction signals
Acceleration threshold detects momentum changes
VIX breakpoints based on historical performance analysis
These values were selected by testing alternatives and choosing the combination that maximized Sharpe ratio.
Weight Distribution
Testing different weight combinations:
Equal weight: Sharpe 0.95
MA emphasis: Sharpe 1.078
Too much MA: Sharpe 0.89
The right distribution assigns higher weight to MA alignment based on its higher predictive value in backtesting. Velocity and acceleration receive equal weight to balance current trend strength with momentum changes.
Scenario Testing Results
Five parameter combinations were tested:
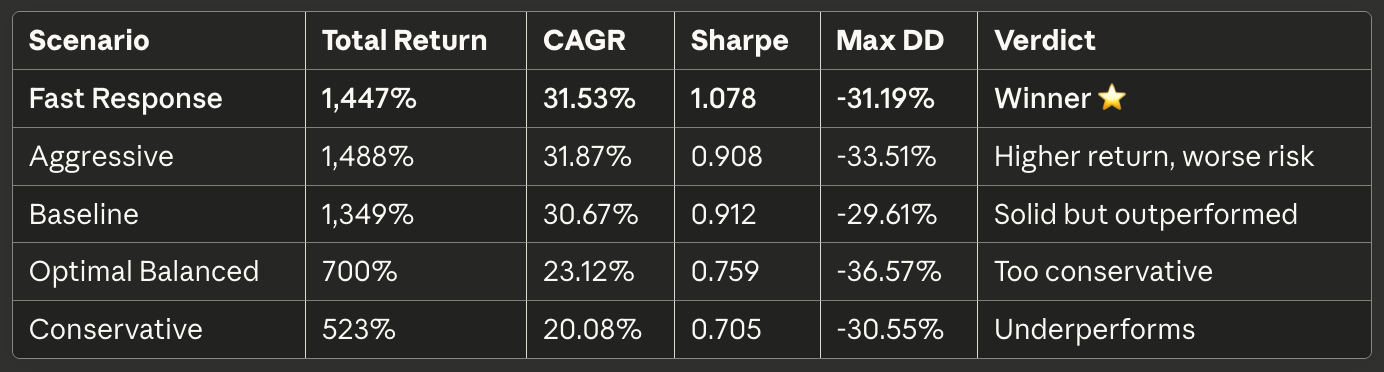
Fast Response was selected for implementation based on achieving the highest Sharpe ratio (1.078). While Aggressive achieved slightly higher absolute returns (1,488% vs 1,447%), its lower Sharpe ratio (0.908) indicates inferior risk-adjusted performance.
Key Implementation Differences
1. Volatility Regime Filtering
My new version integrates VIX levels into position decisions, reducing exposure during high-volatility periods when leveraged ETF decay accelerates.
2. Continuous Position Sizing
Position sizing uses fractional leverage factors (0.5x, 0.7x, 0.8x, 1.0x) rather than binary on/off signals. This reduces turnover and allows gradual exposure adjustments.
3. Multi-Dimensional Trend Analysis
It’s not just “is price above the 50-day MA?” The system synthesizes:
Cross-timeframe alignment
Rate of change (velocity)
Change in rate of change (acceleration)
When all three dimensions align, that’s when you load the boat.
4. Empirically Optimized
Every parameter was tested against alternatives. Nothing is arbitrary. Moving averages, velocity thresholds etc. were all tested against multiple scenarios.
The Bottom Line
$100,000 invested in November 2015 → $1,547,500 in November 2025
31.53% annual returns
Sharpe ratio of 1.078
Maximum drawdown of just -31.19%
Win rate of 48.39% (asymmetric payoffs matter more)
Compare this to:
QQQ buy-and-hold: $415,000 (good, but 3.7x less)
TQQQ buy-and-hold: $2,256,000 (higher return, but -82% drawdown and 0.487 Sharpe—would you survive it?)
Closing
Fast isn’t always best, but it was best here. The 2015-2025 period favored responsive systems. Different periods might favor different parameters.
Position sizing matters more than entries. Variable leverage reduces whipsaws and improves consistency.
Leveraged ETFs carry significant risks and may not be suitable for all investors. The information presented in Math & Markets is not investment or financial advice and should not be construed as such.